# Load panel and enable interactive features
import panel as pn

pn.extension()Lecture 9B: From Notebooks to the Web: Panel
- Section 401
- Nov 1, 2023
Web-based Data Viz
This week and next week, we’ll discuss ways to translate our analysis results to the Web in a meaningful way. We’ll cover two methods to do so, each with their own pros and cons:
Last lecture
- Embedding interactive charts on the Web via Quarto & Github Pages
This lecture and next week
- Creating Web apps & dashboards using the Python library Panel
Part 1: A brief aside on web servers
A few quick basics before we move on to interactive Web apps with Panel…
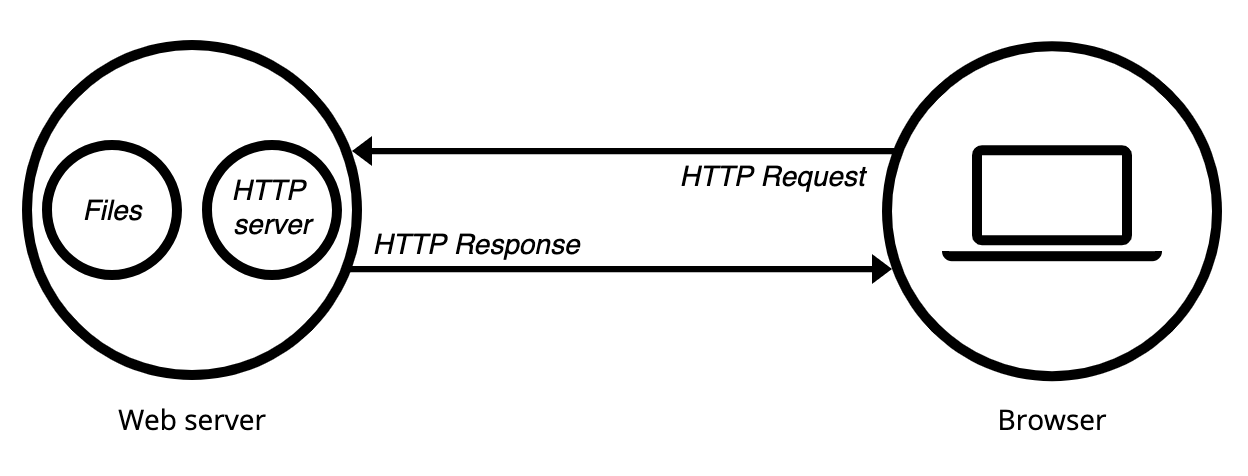
Some (oversimplified) basics
- The browser needs a file –> it requests it via a “get” request using the HTTP protocol
- The web server receives the request, and if the requested file exists, sends it back to the browser using HTTP
Two main types
Static and dynamic
Static Web Servers
- Serves hosted HTML files to the browser “as-is”
- Response from the server is always the same, regardless of what the user does — static
- Example: Our Quarto-generated sites hosted via Github Pages from last lecture
Heads up!
The term “static” here is a little confusing! As we saw last week with GitHub Pages, static sites can still contain interactive visualizations. The interactive features are enabled via the underlying Javascript contained in the visualizations.
Most importantly, static sites can’t execute any Python code to change what is displayed!
Dynamic Web Servers
- Capable of serving dynamic content to browsers
- Extra software that executes server-side before sending the response back to the browser
- Common example: APIs
- Browser sends request for data with specific query parameters
- API server responds dynamically, sending the requested data
Dashboards
As we will see soon, Python dashboards need to be hosted on dynamic servers. The user will change parameters, the server will execute the necessary Python code, and the dashboard will update.
For more information on Web servers, check out the Mozilla documentation.
Flashback: The CARTO API
This is an example of a dynamic web server

API requests are just like dashboards!
You can think of API requests as very similar to hosted Python dashboards, also known as web apps:
APIs: API requests include query parameters that the user specifies in order to ask for specific types of data | back.
Dashboards: Dashboards will take input parameters from a user via widgets, the server executes the necessary code, and the dashboard updates to reflect the user input
Part 2: Panel
![]()
The result of Python programmers asking the question: can we build a dashboard just in Python?
The answer is yes…for the most part.
You still need to use some CSS styling and general knowledge about HTML. But everything is coded in Python.
A high-level dashboarding solution in Python
- Relatively new: announced in 2019 and they just reached version 1.0 in May 2023
- In my opinion, one of the most promising dashboard libraries so far
Key Features: - ⭐️ It is designed to be plotting-library agnostic, fully supporting a wide range of Python libraries out of the box - Works just as well in a Jupyter notebook as on a standalone secure web server - ⭐️ Out-of-the-box support for big data libraries datashader and dask - ⭐️ Large set of interactive and aesthetically pleasing widgets` - Support for custom and more complex layouts (e.g., multi-page apps)
Above, I’ve put a ⭐️ next to the three features that I think separate Panel from the other dashboarding libraries in Python
The “Big 4”
Right now, there a four “big” dashboarding libraries in Python (with newer one starting up often!):
Recommended Reading
I recommend reading through this blog article by Quantsight for a great discussion of the current state of Python dashboarding (as well as a little bit of dataviz history).
From this article by Quantsight:

From the Panel FAQs:

Key feature: Panel provides the best support for working in Jupyter notebooks, allowing you to do the entire data wrangling workflow and dashboard deployment in a Jupyter notebook
Built on top of the HoloViz ecosystem

Key feature: Panel is the only package to support datashader, dask, and visualizing large datasets
Recommended Readings/Videos for Panel
Dashboard apps in Panel
- Panel contains multiple different APIs to create interactive dashboards.
- Allows you to make a dashboard from a single function, or build up more complex dashboards with many components
When using Panel, the general workflow will involve the following steps:
- User changes some parameters via widgets
- The dashboard knows which charts depends on those parameters
- The necessary functions are executed to properly update the dashboard
This is a reactive workflow.
The default panel import
Key concepts
1. Panes - A Pane wraps external viewable items like Bokeh, Plotly, Vega/Altair, or HoloViews plots, so they can be embedded in a dashboard. When the wrapped object or any parameter changes, a pane will update the view accordingly. - Check out the Panes section of the component gallery for the full set of available panes – there are many! - See more info on the docs
2. Widgets - A wrapper for the values the user selects, which determines which Panes get updated and which data is shown in the dashboard - Check out the Widgets section of the component gallery for the full set of available widgets – there are many! - See more info on the docs
3. Panels - Layout objects allow combining plots into a Row, Column, Tabs or a Grid. - See the Layout section of the component gallery for the full set of available layouts - See more info on the docs
Overall, there is always a layout piece and a reactive parameter/callback piece.
The Param library
![]()
- Widgets in Panel are implemented using Parameter objects from the
Paramlibrary - These widgets allow you to declare the parameters of a dashboard in a declarative manner.
- Parameters have corresponding widgets for the user can change their value
- Example parameters/widget combos are available on the Panel docs
Key things to know about Parameters
- Parameters drive the reactive nature of Panel dashboards
- Think of Parameters as references to a value, similar to how Excel works
- In excel, when you reference a particular cell in the formula of another cell, changing the original cell will automatically trigger an update in all cells that reference. The same concept applies to Parameter objects.
For example:
text = pn.widgets.TextInput()
text
# The "value" Parameter of this widget reflects the current value at the time the code is executed
text.value'Hello!'# This is the reference to the live value, just like a cell reference in excel
text.param.value <param.parameterized.String at 0x179bd3600>More on this to come!
Panel APIs: different ways to use Panel
There are three main ways (what they call APIs) to use Panel to create dashboards:
- Interact functions: Auto-generates a full UI (including widgets) given a function
- Reactive functions: Linking functions or methods to widgets using pn.bind or the equivalent pn.depends decorator, declaring that the function should be re-run when those widget values change
- Parameterized classes: Declare parameters and their ranges in Parameterized classes, then get GUIs (and value checking!) for free
Reference: See the API section of the User Guide for a more detailed discussion
Quick API demo: the “cars” dataset
We’ll demonstrate the three Panel APIs by creating the same, small dashboard using the “cars” example dataset. Then, we’ll dive into more complex and realistic examples!
import hvplot.pandas
from bokeh.sampledata.autompg import autompg # cars datasetautompg.head()| mpg | cyl | displ | hp | weight | accel | yr | origin | name | |
|---|---|---|---|---|---|---|---|---|---|
| 0 | 18.0 | 8 | 307.0 | 130 | 3504 | 12.0 | 70 | 1 | chevrolet chevelle malibu |
| 1 | 15.0 | 8 | 350.0 | 165 | 3693 | 11.5 | 70 | 1 | buick skylark 320 |
| 2 | 18.0 | 8 | 318.0 | 150 | 3436 | 11.0 | 70 | 1 | plymouth satellite |
| 3 | 16.0 | 8 | 304.0 | 150 | 3433 | 12.0 | 70 | 1 | amc rebel sst |
| 4 | 17.0 | 8 | 302.0 | 140 | 3449 | 10.5 | 70 | 1 | ford torino |
# Set up a function to plot using hvplot
def autompg_plot(x="mpg", y="hp", color="#058805"):
    return autompg.hvplot.scatter(x, y, c=color, padding=0.1)

# Get the columns to use
columns = list(autompg.columns[:-2])
columns
['mpg', 'cyl', 'displ', 'hp', 'weight', 'accel', 'yr']1. Interact Functions
The interact function will magically generate a UI (including widgets) automatically by inspecting the arguments of the function given to it.
In the case below, we give the autompg_plot() the allowed options for its 3 arguments x, y, and color, and it auto-generates a Panel dashboard.
layout[1]# Create a widget to select the color of the scatter points
color = pn.widgets.ColorPicker(name="Color Selector", value="#4f4fdf")
# Auto-generate the layout
layout = pn.interact(autompg_plot, x=columns, y=columns, color=color)
# Create the dashboard with a Row and Column
interact_dashboard = pn.Row(pn.Column("## MPG Explorer", layout[0]), layout[1])
interact_dashboard
#layoutWe’ve seen similar Panel dashboards before!
autompg.hvplot.explorer()Takeaway: For my taste, the interact API is a little too simple. I prefer to have more control over the dashboard. For that reason, I prefer to use the next two APIs the most often.
2. Reactive Functions
- Very similar to the
interactAPI but is more explicit about widget selection and layout. - You must use the
pn.bindfunction to select and configure widgets explicity and to lay out components explicitly. - The
pn.bind()function explicitly links the values of the widgets to the arguments of a function.
Find out more
For more info, see this discussion of the pros and cons of this approach.
# Create the widgets
xSelect = pn.widgets.Select(value="mpg", options=columns, name="x")
ySelect = pn.widgets.Select(value="hp", options=columns, name="y")
colorPicker = pn.widgets.ColorPicker(name="Color", value="#AA0505")

# Create the dashboard
reactive_dashboard = pn.Column(
    pn.Row(
        pn.bind(autompg_plot, x=xSelect, y=ySelect, color=colorPicker),  # Main chart
        pn.Column(
            "## MPG Explorer", xSelect, ySelect, colorPicker
        ),  # Title and widgets
    ),
)

reactive_dashboard
To be continued!
More Panel next week…